Monster Beverage Corporation is an American beverage company that manufactures energy drinks including Monster Energy, Relentless, Reign and Burn. The company was originally founded as Hansen's in 1935 in Southern California, originally selling juice products. The company has demonstrated consistent top-line growth at a 12% compound annual growth rate (CAGR) over the past decade and is poised for nearly double-digit growth over the next five years, bolstered by a robust pipeline of innovative products and increasing market share.

The current price as of 2nd April 2026 is $72.37, holding just above the rising 40 week moving average of $71.06. The price is also hovering above the Fibonacci 38.2% retracement at $70.54 based on the entire $43.32 to $87.38 range traded since August 2024.

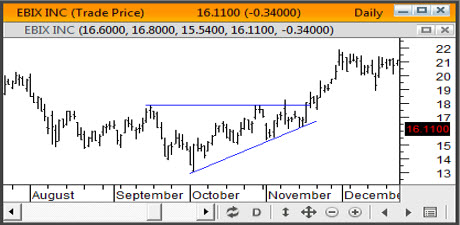
On the daily chart, the MACD-V indicator is at minus 170 and forming a rounding bottom. The stochastic momentum index is starting to negate the downward trend. It will be interesting to see if this stock can hold up at current levels. If this is the case, then the chances of a recovery towards the $90 area are excellent.
Disclaimer
Our opinions are not a recommendation to buy or sell a security. Your decision whether or not to open a transaction should be based on your own due diligence and not on any representation we make to you.